Getting Started
In this document, we provide an introductory overview of the data, functions and results
for how to use cdcam with an example project.
To quickly run the model and inspect the outputs see the self-contained reproducible example:
python scripts/example.py
Alternatively, to reproduce a piece of more detailed analysis, you can access a prepared dataset on Zenodo as follows.
- download the data from the Zenodo repository, https://doi.org/10.5281/zenodo.3525286
- copy
scripts/script_config.template.initoscripts/script_config.iniand edit thebase_pathvalue to match the location of your downloaded data - run
scripts/run.pyto generate results
The data available from the Zenodo repository contain a number of folders including:
- Mobile coverage information from Ofcom (
ofcom_2018). - Population growth scenarios for local authority districts (
population_scenarios). - Polygon shapes for postcode sectors and local authority districts (
shapes). - Sitefinder cell site location data (
sitefinder). - Capacity lookup table data by spectrum frequency (
system_simulator).
This data was prepared to analyse digital connectivity in the Oxford-Cambridge Arc, which is an area in the South East United Kingdom with high potential for growth, and proposed transport and housing developments.
The analysis and figures below are taken from the report ‘A sustainable Oxford-Cambridge corridor? Spatial analysis of options and futures for the Arc: Executive Summary’ (November 2019) published by the Infrastructure Transitions Research Consortium, available online.
A major motivation for this scenario analysis is to examine how changes in population and urban development might impact on infrastructure service demands, and what might need to be done to meet those needs or expectations.
For our purposes, we are provided with scenarios of future population change. Figure 1 shows two scenarios of future urban development, corresponding approximately to the locations of future residential population. The ‘Expansion’ scenario focusses growth around existing urban areas, whereas the ‘New settlements’ scenario introduces five new towns.
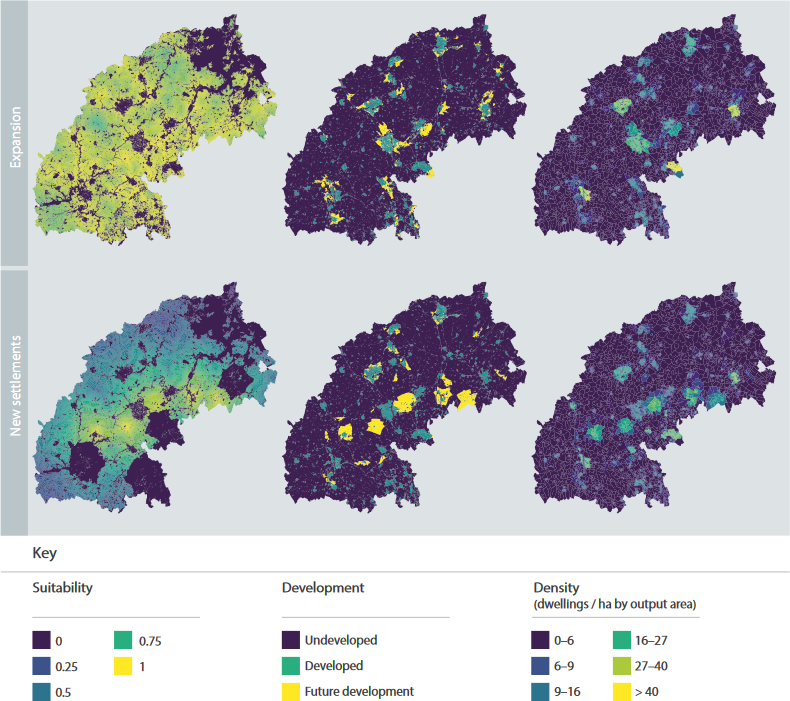
Figure 1. Scenarios of urban development suitability, future development and density in 2050.
Then we can test different strategies for future mobile digital infrastructure, running
cdcam under the different population scenarios.
Broadly, cdcam works at three levels to simulate digital mobile infrastructure: estimating
bandwidth demand, simulating infrastructure bandwidth capacity, then following some strategy to
build more infrastructure as necessary. First cdcam takes population (people/km²) and
monthly data usage per person (GB/person/month), to estimate peak hour demand (Mbps/km²). Then
it loads the mobile cell sites, with details of the technology, spectrum and bandwidth, in each
region, to estimate the cell-edge capacity (Mbps/km²). Finally an optional service coverage
obligation and any unmet demand are used to prioritise investment in available technologies -
where each strategy makes different 5G technologies available.
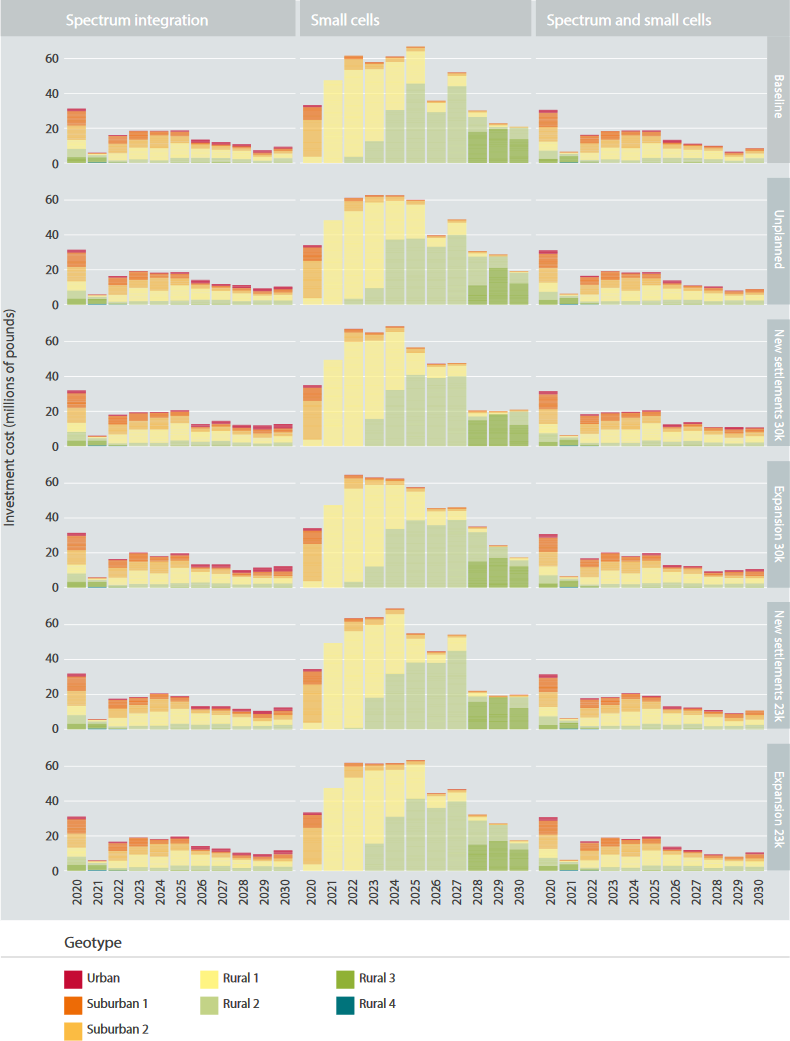
Figure 2. Investment in digital mobile infrastructure by settlement type, for three strategies and six population scenarios.
Figure 2 shows a summary of infrastructure investment in the Oxford-Cambridge Arc region, as mobile broadband (5G) technologies roll out under the different scenario/strategy combinations. In the aggregate, there is very little difference in spend between the population scenarios. This is partly because data demand is projected to grow at a much higher rate than any population scenario. Between the strategies, small cells are potentially much more expensive than a spectrum-only or hybrid approach.
The rest of this page walks through how to set up and interact with the simulation model.
Create a NetworkManager
The cdcam.model.NetworkManager object represents the whole system under simulation.
It requires the following inputs:
- local authority districts (LADS)
- postcode sectors
- assets
- capacity lookup table
- clutter lookup
- simulation parameters
A local authority district (upper level statistical unit) needs to contain name and id fields, and be part of a list of dictionaries:
lads = [
        {
            "id": "E07000008",
            "name": "Cambridge",
        },
        ...
    ]
Equally, each postcode sector (lower level statistical unit) must contain the upper level lad id (lad_id), the area in kilometers square (area_km2), postcode sector id (id), average user data consumption (user_throughput), and population for the timestep being modelled, as follows:
pcd_sectors = [
        {
            "id": "CB11",
            "lad_id": "E07000008",
            "population": 5000,
            "area_km2": 2,
            "user_throughput": 2,
        },
        {
            "id": "CB12",
            "lad_id": "E07000008",
            "population": 20000,
            "area_km2": 2,
            "user_throughput": 2,
        },
        ...
    ]
Existing cell site data is required, which is referred to here as the initial system. Each cell site needs to contain the current cellular generation present (technology) such as 4G, the type of cell site (type), the date the site was built (build_date), the site id (site_ngr), the frequencies deployed (frequency) and the postcode sector id which the site is within (pcd_sector):
initial_system =  [
        {
            "pcd_sector": "CB11",
            "site_ngr": "site_100",
            "technology": "",
            "type": "macrocell_site",
            "frequency": [],
            "bandwidth": "",
            "build_date": 2012,
            "sectors": 3,
            'opex': 10000,
        },
        {
            "pcd_sector": "CB12",
            "site_ngr": "site_200",
            "technology": "",
            "type": "macrocell_site",
            "frequency": [],
            "bandwidth": "",
            "build_date": 2012,
            "sectors": 3,
            'opex': 10000,
        },
        ...
    ]
The capacity lookup table needs to be loaded as follows (see details in the
NetworkManager API documentation):
capacity_lookup_table = {
        ('urban', 'macro', '3700', '40', '5G'): [
            (0.11276372445109878, 5.101430894167686),
            (0.20046884346862007, 21.097341086638664),
            (0.4510548978043951, 79.9233194517426),
            (1.8042195912175805, 319.6932778071853)
        ],
        ...
    }
The clutter lookup table details the population densities which represent different urban, suburban or rural environments:
clutter_lookup = [
        (0.0, 'rural'),
        (782.0, 'suburban'),
        (7959.0, 'urban')
    ]
A dictionary of simulation parameters is required containing annual budget, market share, any frequency bandwidths etc.:
simulation_parameters = {
        'annual_budget': 1e6,
        'market_share': 0.3,
        'channel_bandwidth_700': '10'
    }
And then create a NetworkManager called system:
system = NetworkManager(lads, pcd_sectors, assets, capacity_lookup_table,
                        clutter_lookup, simulation_parameters)
Now you can begin testing interventions!
Decide interventions
Once the NetworkManager has been created, the
decide_interventions() function can then be imported and used from
cdcam.interventions
The decide_interventions() function requires the following inputs:
- strategy
- budget
- service_obligation_capacity
- system
- timestep
- simulation_parameters
The strategy is a string such as:
'small-cell'
and the budget is an integer such as:
500000000
The service obligation is dependent on whether one is specified. If not just use zero:
0
The NetworkManager object created earlier can be passed as the system.
The timestep can be passed as an integer as follows:
2020
And a dictionary of simulation parameters can also be passed:
simulation_parameters = {
        'annual_budget': 1e6,
        'market_share': 0.3,
        'channel_bandwidth_700': '10'
    }
For each time period, decide_interventions() will return three items
including:
- a list of built interventions
- the remaining budget
- the amount of capital spent
The list of built interventions for the small cell strategy will look as follows:
print(interventions_built)

[
    {
        'site_ngr': 'small_cell_site',
        'frequency': ['3700', '26000'],
        'technology': '5G',
        'type': 'small_cell',
        'bandwidth': ['50', '200'],
        'build_date': 2022,
        'pcd_sector': 'CB12',
        'lad_id': 'E07000008',
        'population_density': 110000.0
    },
    ...
]
Results
To obtain results, we can then add the newly built interventions to the existing assets:
assets += interventions_built
And then create an updated NetworkManager which includes new assets:
system = NetworkManager(lads, pcd_sectors, assets, capacity_lookup_table,
                        clutter_lookup, simulation_parameters)
New results can then be obtained by calling methods belonging to each LAD
or PostcodeSector object:
for lad in system.lads.values():
    print('{}:'.format(lad.name))
    print(' ')
    print('-- Demand (Mbps km^2): {},'.format(round(lad.demand())))
    print('-- Capacity (Mbps km^2): {}'.format(round(lad.capacity())))
Which results in the new estimated data demand and capacity of the cellular Radio Access Network in Megabits Per Second (Mbps) per squared kilometers (km^2):
Cambridge:

-- Demand (Mbps km^2): 601,
-- Capacity (Mbps km^2): 475
Preprocessing
To reproduce data preparation, run scripts/preprocess.py. This will take three or four
hours. The results of this step are provided in the intermediate folder.
Running the script should produce output as follows:
$ python scripts/preprocess.py
Output directory will be data\intermediate
Loading local authority district shapes
Loading lad lookup
Loading postcode sector shapes
Adding lad IDs to postcode sectors... might take a few minutes...
100%|██████████████████████████████████████████| 9232/9232 [06:06<00:00, 25.16it/s]
Subset Arc shapes
complete
Loading in population weights
Adding weights to postcode sectors
Calculating lad population weight for each postcode sector
Generating scenario variants
Checking total GB population
Total GB population is 62436917.0
loaded luts
running arc_population__baseline.csv
writing pcd_arc_population__baseline.csv
running arc_population__0-unplanned.csv
writing pcd_arc_population__0-unplanned.csv
running arc_population__1-new-cities-from-dwellings.csv
writing pcd_arc_population__1-new-cities-from-dwellings.csv
running arc_population__2-expansion.csv
writing pcd_arc_population__2-expansion.csv
running arc_population__3-new-cities23-from-dwellings.csv
writing pcd_arc_population__3-new-cities23-from-dwellings.csv
running arc_population__4-expansion23.csv
writing pcd_arc_population__4-expansion23.csv
Disaggregate 4G coverage to postcode sectors
Importing sitefinder data
Preprocessing sitefinder data with 50m buffer
100%|██████████████████████████████████████████| 139741/139741 [3:43:52<00:00, 10.40it/s]
Allocate 4G coverage to sites from postcode sectors
100%|██████████████████████████████████████████| 8964/8964 [00:21<00:00, 411.90it/s]
Convert geojson postcode sectors to list of dicts
Specifying clutter geotypes
Writing postcode sectors to .csv
Writing processed sites to .csv
time taken: 232 minutes